New to KubeVault? Please start here.
Monitoring Vault Server Using Prometheus Operator
CoreOS prometheus-operator provides simple and Kubernetes native way to deploy and configure Prometheus server. This tutorial will show you how to monitor Vault server using Prometheus via Prometheus Operator).
Monitor Vault server
To enable monitoring, configure spec.monitor field in a VaultServer custom resource. Below is an example:
apiVersion: kubevault.com/v1alpha1
kind: VaultServer
metadata:
  name: exampleco
  namespace: demo
spec:
  replicas: 1
  version: "1.2.0"
  serviceTemplate:
    spec:
      type: NodePort
  backend:
    inmem: {}
  unsealer:
    secretShares: 4
    secretThreshold: 2
    mode:
      kubernetesSecret:
        secretName: vault-keys
  monitor:
    agent: prometheus.io/coreos-operator
    prometheus:
      namespace: demo
      labels:
        app: vault
      interval: 10s
Here,
monitor.agentindicates the monitoring agentcoreos-prometheus-operator.monitor.prometheusspecifies the information for monitoring by Prometheus.prometheus.namespacespecifies the namespace where ServiceMonitor is created.prometheus.labelsspecifies the labels applied to ServiceMonitor.prometheus.portindicates the port for Vault statsd exporter endpoint (default is56790)prometheus.intervalindicates the scraping interval (eg, ’10s’)
Now create Vault server with the monitoring spec
$ kubectl create -f https://github.com/kubevault/docs/raw/v0.3.0/docs/examples/monitoring/vault-server/vault-server-coreos.yaml
KubeVault operator will create a ServiceMonitor object once the Vault server is successfully running.
$ kubectl get servicemonitor -n demo
NAME                   AGE
vault-demo-exampleco   23s
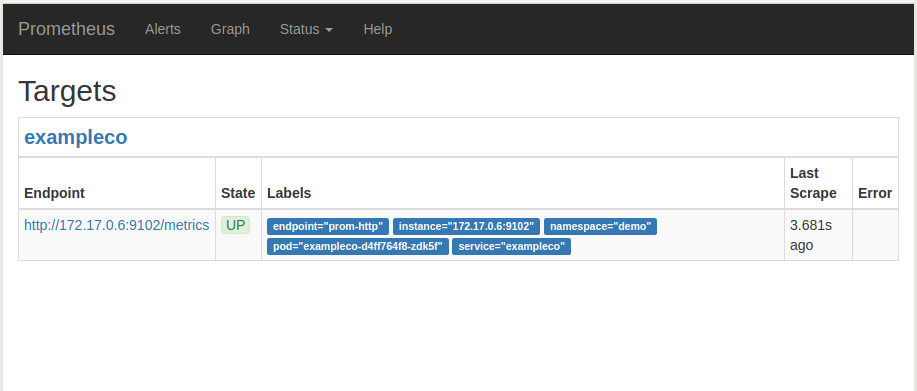
Now, if you go the Prometheus Dashboard, you should see that this Vault endpoint as one of the targets.
Cleaning up
To cleanup the Kubernetes resources created by this tutorial, run:
$ kubectl delete -n demo vs/coreos-prom-postgres

$ kubectl delete ns demo